
Market Proofs
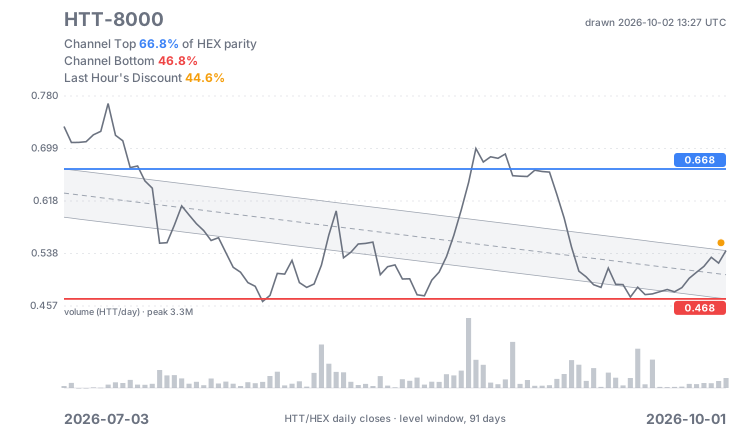
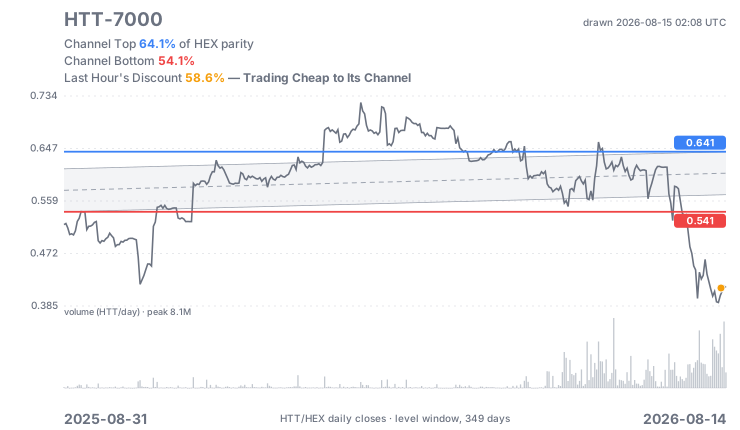
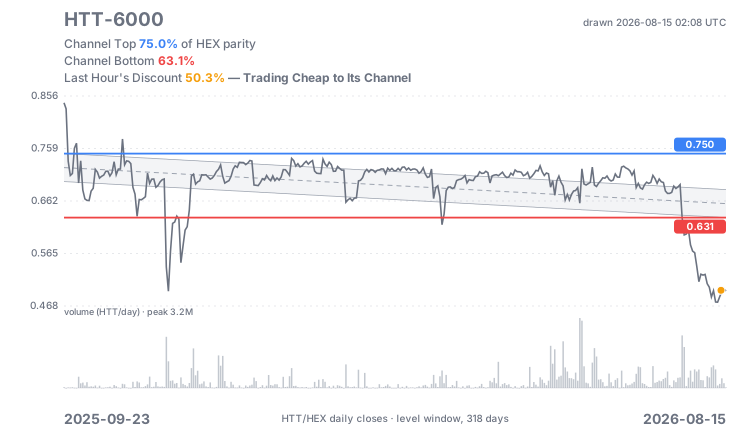
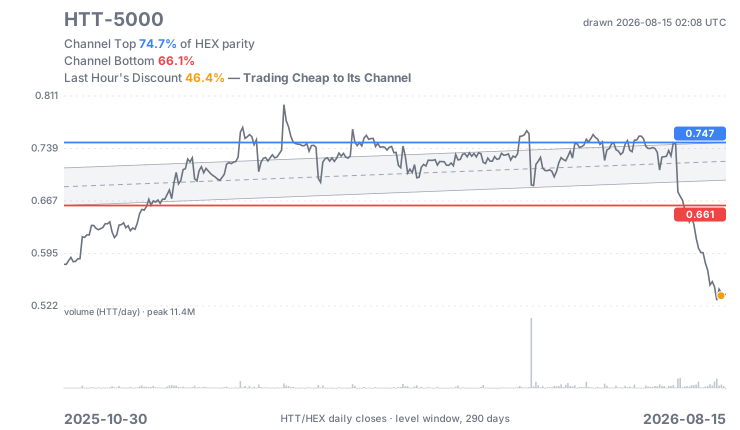
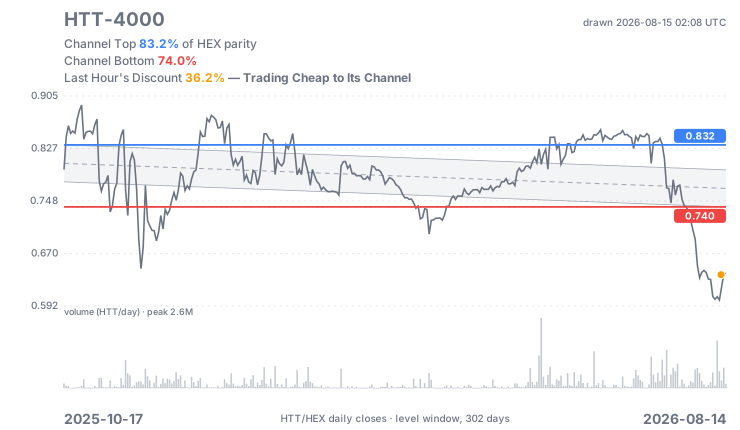
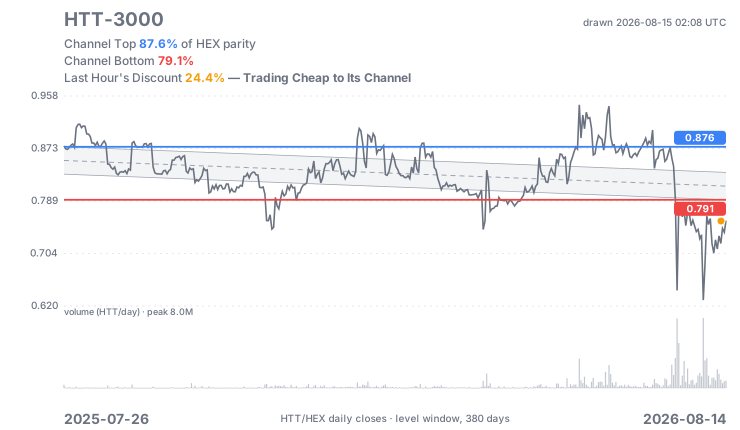
This page forms the Yield Curve page’s Blue-Top & Red-Bottom channels.
Market HTT Prices — HTT/HEX Regression Channels
Updated 2026-10-02 13:27 UTC
- The channel — starts where the trend turns flat (the longest such span), and the channel is the regression ±0.5 standard deviations.
- The blue line marks the channel's top and the red line its bottom — the two levels labeled on the scale.
- Volume across the bottom — notice, volume here has been rising in recent months.
- The idea — mean reversion, explained in Mean Regression Trading.
- Where these feed — the Price Curve and the Curve Table at the top of the Yield Curve page.
Return to Channel
Pools read 2026-10-02 13:27 UTC
- What it measures — Buy HTT: the HEX spent buying the series’ HTT in its main HTT/HEX pool that lifts its price to the channel’s bottom, and to its middle (halfway between the red and blue lines). “Inside” and “Above” mean the price already sits at or above that level.
- The sell side — Sell HTT: the HTT that, sold into the same pool for HEX, drops the price to the middle and to the bottom: how much a new series’ minter can sell before the price leaves the channel’s upper half, or the channel. Under it, the HEX that sale brings out — less than HTT × price, because each sale lowers the price for the next. “Below” means the price already sits at or under that level.
- How — the pool’s own math: lifting the price by a factor r takes the pool’s HEX × (√r − 1), and lowering it takes the pool’s HTT × (√r − 1), plus the 0.29% swap fee. Reserves are read on chain; levels are this morning’s channel (2026-10-02); dollars at the 2026-10-02 HEX price.
- A floor, not a forecast — the least buy that gets there, with nobody selling into it; holders who sell on the way up raise the cost. The same holds for a sale: buyers stepping in on the way down let more be sold.
- Sorting — tap a heading to rank by it, highest first; tap again for lowest first.
| Series | Price (HEX) | Bottom | Middle | Buy HTT to Bottom | Buy HTT to Middle | Sell HTT to Middle | Sell HTT to Bottom |
|---|---|---|---|---|---|---|---|
| HTT-8000 | 0.55 | 0.47 | 0.57 | Inside | 53k HEX<$1k | Below | 703k HTT357k HEX$1k |
| HTT-7000 | 0.52 | 0.53 | 0.57 | 445k HEX$1k | 1,895k HEX$6k | Below | Below |
| HTT-6000 | 0.63 | 0.59 | 0.68 | Inside | 912k HEX$3k | Below | 1,296k HTT788k HEX$2k |
| HTT-5000 | 0.66 | 0.65 | 0.68 | Inside | 298k HEX<$1k | Below | 345k HTT226k HEX<$1k |
| HTT-4000 | 0.73 | 0.70 | 0.78 | Inside | 444k HEX$1k | Below | 529k HTT378k HEX$1k |
| HTT-3000 | 0.73 | 0.74 | 0.81 | 75k HEX<$1k | 574k HEX$2k | Below | Below |
What Holds the Ratio — Heart’s Law, Measured
295-day study · 2026-07-27
The channels above are the visible example — the trace left on a chart. They are worth showing, but they are not the reason an HTT price follows HEX. The reason is structural, it can be measured, and this section is that measurement.
The Idea, in One Line
Heart’s Law — tokens that share liquidity rise and fall together. A pool holds two tokens against a constant product, so every trade moves both sides at once. The power is not in noticing this; it is in building it. Bind a token into an established one deliberately, across many pools, and it inherits that token’s price behavior. A token held by eight pools at once is far harder to knock loose than one held by a single thin market.
Actuator Is the Tightest-Bound Ecosystem We Can Find
Binding asks how much of HEX’s volatility the HTT/HEX ratio refuses to pass through. 1.00 would be a perfect peg; 0.00 means the pool has no hold at all. Every token below is measured over the same 295 days against the partner it is actually pooled with.
- The HTTs win as a class — mean 0.607 across the five, and three of them take the top three places outright. Stated honestly: PLSX at 0.550 lands inside the HTT range, above two of them, so the class wins on average and on mechanism — not on every row.
- ACTR is the control experiment — Actuator’s own token binds at just 0.118. Binding is not something a token catches from the project it belongs to. HTTs track HEX because each is a redeemable claim on HEX, not because they are “Actuator things.”
- USDC marks the boundary — -0.002, or nothing at all, despite sitting in a large WPLS pool. A token redeemable at par for something outside the pool cannot be dragged by it. That is a currency board, and knowing where the law stops is what makes it a usable test.
| Token | Bound to | Binding | What it is |
|---|---|---|---|
| HTT-3000 | HEX | 0.671 | Actuator instrument |
| HTT-4000 | HEX | 0.492 | Actuator instrument |
| HTT-5000 | HEX | 0.714 | Actuator instrument |
| HTT-6000 | HEX | 0.533 | Actuator instrument |
| HTT-7000 | HEX | 0.624 | Actuator instrument |
| PLSX | WPLS | 0.550 | PulseX — binding is incidental, not designed |
| HEX | WPLS | 0.425 | the reserve asset itself |
| INC | WPLS | 0.420 | PulseX farm token |
| WETH | WPLS | 0.181 | bridged — priced by the outside market |
| ACTR | HEX | 0.118 | Actuator’s own token — the control |
| USDC | WPLS | -0.002 | a currency board — the pool has no hold at all |
An HTT Is a Currency Board on HEX — with a Date on It
That boundary is not a weakness in Actuator’s case — it is the design. Every HTT is fully collateralized by a delegated stake and becomes convertible 1:1 for HEX at its maturity date: 100% reserves, fixed rate, open window — the structure Steve H. Hanke and Kurt Schuler describe for national currency boards. The only difference is the clock. Before maturity the window is not yet open, so the market prices the wait as a discount. Read the average level of each ratio in order and that pricing is the whole yield curve.
- The order never breaks — across all 295 days, the further the maturity, the deeper the average discount. No inversions in that ordering. That is the price curve, and the channels above are six windows onto it. Annualized it is another matter: on 2026-10-02 HTT-3000 paid 25.7% a year and HTT-7000 5.4% — the yield curve is inverted (the Due Diligence YTM column).
- Pool depth, so “thin” is a number — $570,321 across the 5 pools this study measures, as of 2026-10-02, the smallest at $57,325. Every price on this page comes out of those pools, which is why trade size matters (Slippage).
- One thing we tested and disproved — we expected binding to tighten as maturity approached. It does not. The apparent relationship decayed from -0.76 at 11 days to -0.45 at 90 to -0.089 at 295 — the signature of noise, not signal. The discount orders by maturity; the tightness does not.
| Maturity | Days away | Avg. level vs HEX | Discount | Pool depth (2026-10-02) |
|---|---|---|---|---|
| HTT-3000 | 504 | 83.3% | 16.7% | $57,325 |
| HTT-4000 | 1,504 | 79.6% | 20.4% | $82,073 |
| HTT-5000 | 2,504 | 70.3% | 29.7% | $102,471 |
| HTT-6000 | 3,504 | 70.2% | 29.8% | $128,441 |
| HTT-7000 | 4,504 | 61.2% | 38.8% | $200,011 |
How these numbers were made. Every figure is read straight from PulseX pool reserves over archive state on the public PulseChain RPC — 301 samples, one per 8,173 blocks (an assumed one-day stride), spanning 295 calendar days (2025-10-05 to 2026-07-27) — PulseChain's blocks ran slightly fast, so 300 block-day strides landed in 295 calendar days. No third-party price API is used at any step: USD comes from the WPLS/DAI pool, and every other price is derived through the pools themselves, so the whole chain is reproducible by anyone with an RPC endpoint. Binding is 1 − (volatility of the pair ratio ÷ volatility of the partner’s own price), on daily log changes. It is deliberately not a correlation: correlation confounds pool binding with ordinary market drift — bridged WETH correlates 0.399 with WPLS yet binds only 0.181, because that co-movement is risk-asset beta, not the pool. Measured 2026-07-27; a one-off study, not a daily feed, so treat the levels as of that date.
About these charts:the regression-channel charts are generated daily from each pool's price history (GeckoTerminal data, prices in HEX terms) — each window starts where the trend turns level (the longest flat span available), the channel is the regression ±0.5σ, and the blue/red lines mark its top and bottom levels. Not financial advice. Always do your own research.